NDDcluster
From Zhang Laboratory
Introduction
This algorithm is based on a nonparametric estimation of the normalized density derivative (NDD) and the local convexity of the density distribution function, both of which are represented in a very concise form in terms of neighbor numbers. We use NDD to measure the dissimilarity between each pair of observations in a local neighborhood and to build a connectivity graph. Combined with the local convexity, this similarity measure can detect observations in local minima (valleys) of the density function, which separate observations in different major clusters. We demonstrate that this algorithm has a close relationship with the single-linkage hierarchical clustering and can be viewed as its extension. The performance of the algorithm is tested with both synthetic and real datasets. An example of color image segmentation is also given. Comparisons with several representative existing algorithms show that the proposed method can robustly identify major clusters even when there are complex configurations and/or large overlaps.
Matlab code download (last update: Dec 2003)
Reference:
Zhang, C., Zhang, X., Zhang, M.Q. and Li, Y. 2007. Neighbor Number, Valley Seeking and Clustering. Pattern Recognition Letters, 28:173-180.
Example 1
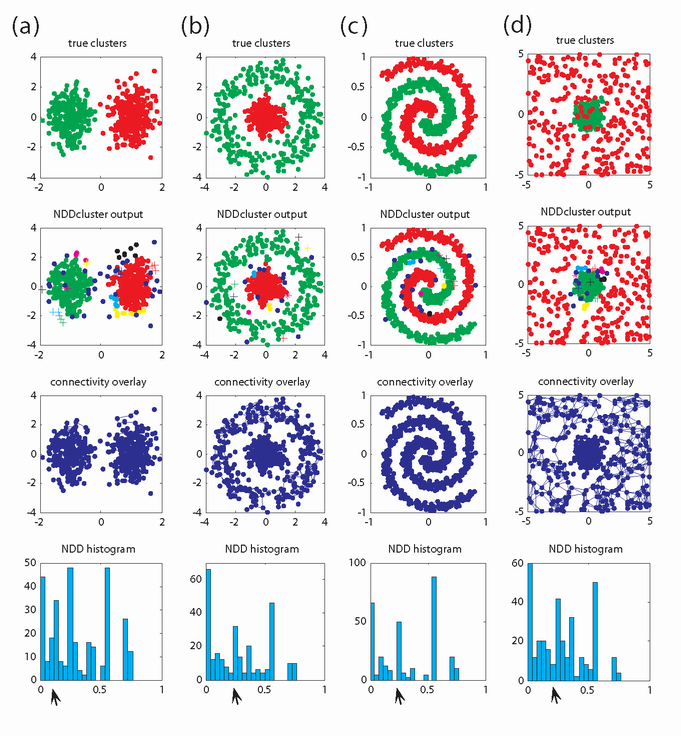
Illustrative synthetic data with various typical configurations.In each panel are ground truth, clustering result, connectivity matrix overlaid on the scatter-plot and the distribution of NDD, respectively, from top to bottom. (a) Gaussian mixtures. (b) concentric circles (c) dual spirals (d) mixture of a normal distribution and a uniform distribution. Note that in (a) the scatter plots are not drawn to scale.
Example 2
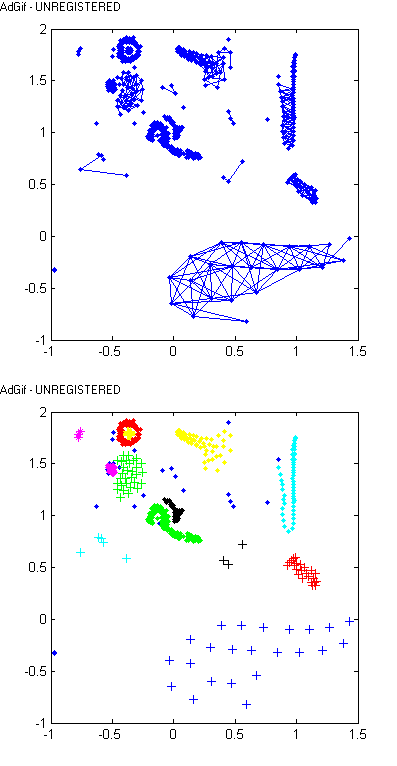
Illustrative synthetic data with more complex configurations. Different clusters are represented by different marker colors and styles. The connectivity map is shown in animation.
Example 3
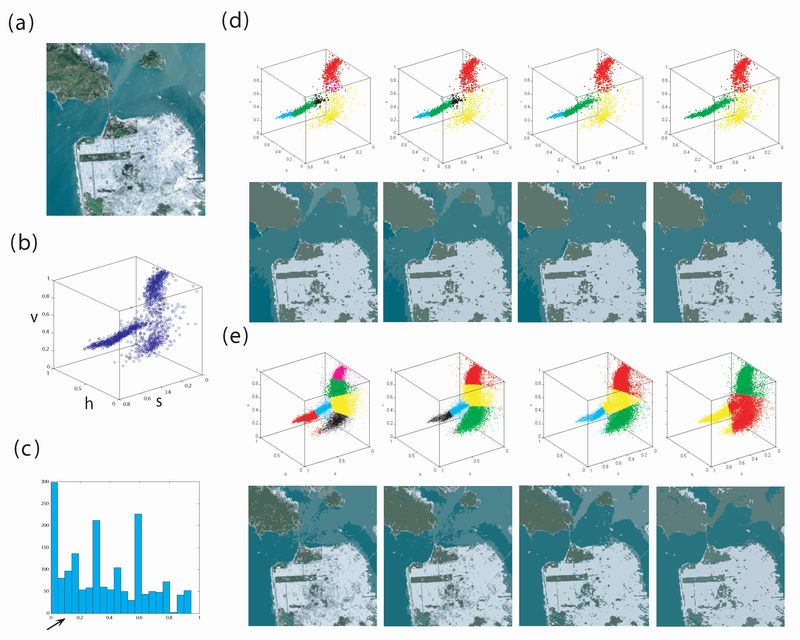
An application of color image segmentation. (a) The original image. (b) Scatter-plot of 2000 pixels in HSV space uniformly sampled from the image. (c) Distribution of the NDD. (d and e) Clustering and segmentation results by the proposed algorithm (d) and K-means (e) with cluster number = 6, 5, 4 and 3, from left to right.


